Update: 01/10/2022 - Check out the underlying Dune dashboards and valuation models:
Revenue: Ethereum | Polygon | BNB Chain | Fantom | Avalanche | Arbitrum | Optimism.
TX Count and Gas Costs: Ethereum | Polygon | BNB Chain | Fantom | Avalanche | Optimism | Arbitrum | Solana.
Intro
Chainlink offers a number of different products:
Chainlink Data Feeds supply dApps with secure, reliable, and decentralized off-chain data.
Chainlink VRF supplies dApps with randomness for use in minting NFTs, distributing random rewards, etc.
Chainlink Automation (formerly Keepers) enables dApps to outsource/automate smart contract transactions via Chainlink’s decentralized oracle network.
Chainlink Proof of Reserve (PoR) enables reliable and timely monitoring of reserve assets.
Cross-Chain Interoperability Protocol (CCIP) is a cross-chain messaging standard.
I focus only on Chainlink Data Feeds since the other use cases are largely speculative at this point.
KPIs
Integrations: Chainlink quarterly integrations are slowing down with 582 integrations in FY22 versus 712 integrations in FY21.
Developers: Chainlink ranks 11th in active developers after growing 7% Y/Y to 61. It is currently the #1 dApp in terms of active developers, and the only non-L1/L2 in the top 20.
Total Value Secured (TVS): Chainlink TVS is down 84% YTD from $57bn to $9bn. This is slightly worse than DeFi TVL, which is down 77% from $167bn to $39bn YTD. Chainlink TVS as a percentage of DeFi TVL therefore shrunk 11% from 34% to 23% Y/Y.
Transaction Value Enabled (TVE): Monthly TVE is down 83% from the start of the year from $1.71T to $0.298T. TVE decreased 59% in Q2 2022, 32% in Q3 2022, and 22% in Q4 2022. Note: I critique Chainlink Labs’ calculation of TVE in [1], but it is likely directionally correct.
Earnings
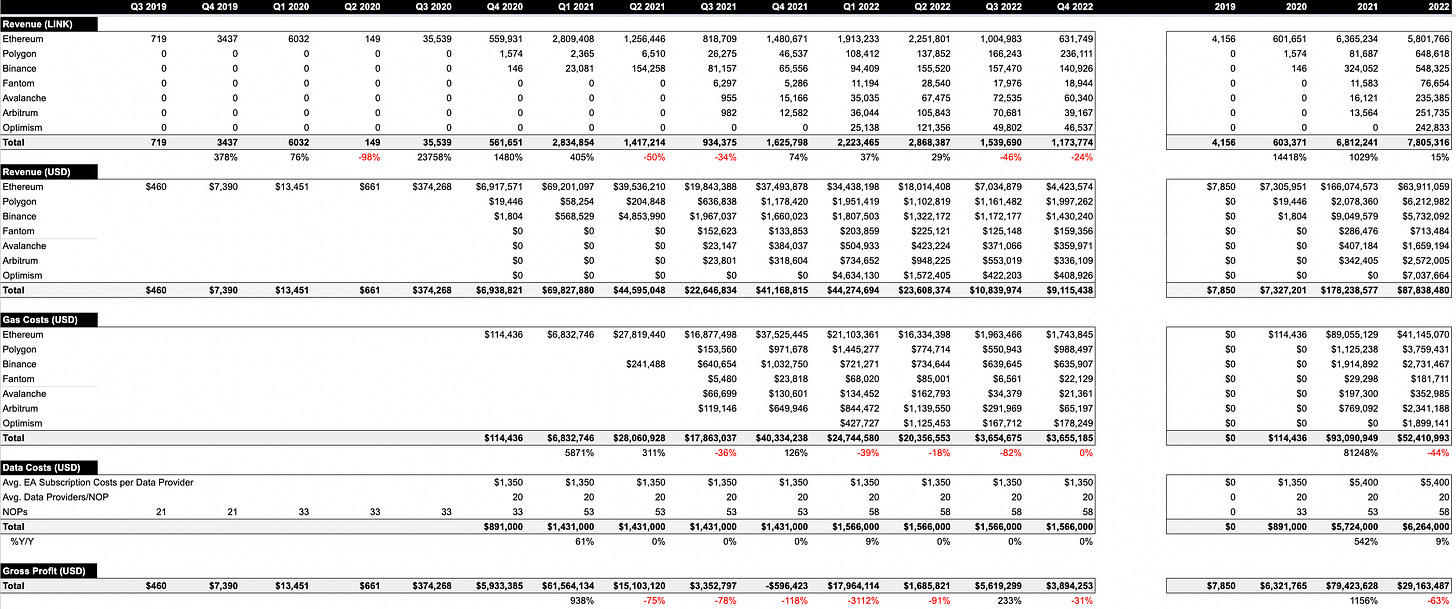
Revenue is down 51% Y/Y from $178mm to $88mm despite LINK rewards up 15% from 6.81mm to 7.81mm. The decline in revenue is largely thanks to the average LINK price dropping 58% from $26 to $11 (and now $6.15).1
Cost of Goods & Services is down 38% Y/Y from $95mm to $59mm.
Gas costs dropped 44% Y/Y from $93.09mm to $52.41mm, largely driven by a 54% decline in Ethereum gas costs from $89mm to $41mm.
Data subscription costs are up 9% from $5.72mm to $6.26mm.
Gross Profit is down 63% Y/Y from $79mm to $29mm.
Operating Expenses are up 159% from $3.25mm to $8.42mm
Net Income is down 73% Y/Y from $57mm to 16mm.
Note: These figures exclude Chainlink Price Feed TXs on Solana, HECO, Moonriver, Harmony, Metis, Moonbeam, Gnosis, which collectively increased revenue 191% from $0.11mm to $0.32mm and represent 0.37% of network revenue. They also exclude Chainlink VRF and Automation revenue, which increased 75% Y/Y to $4.33mm and 18% to $0.71mm, respectively. Hence they omit an additional $5.36mm (+6%) in revenue. See appendix.
Margins: GPM decreased 12% from 45% to 33% Y/Y on the whole, and net income margins decreased 14% from 32% to 18% Y/Y.
GPM shrunk 27% for Binance, 15% for Fantom, 10% for Ethereum, and 7% for Polygon. GPM for Ethereum is still much better than the ~0% in Q4 2021.
GPM improved 27% Y/Y for Avalanche and 134% for Arbitrum.
Silver Linings
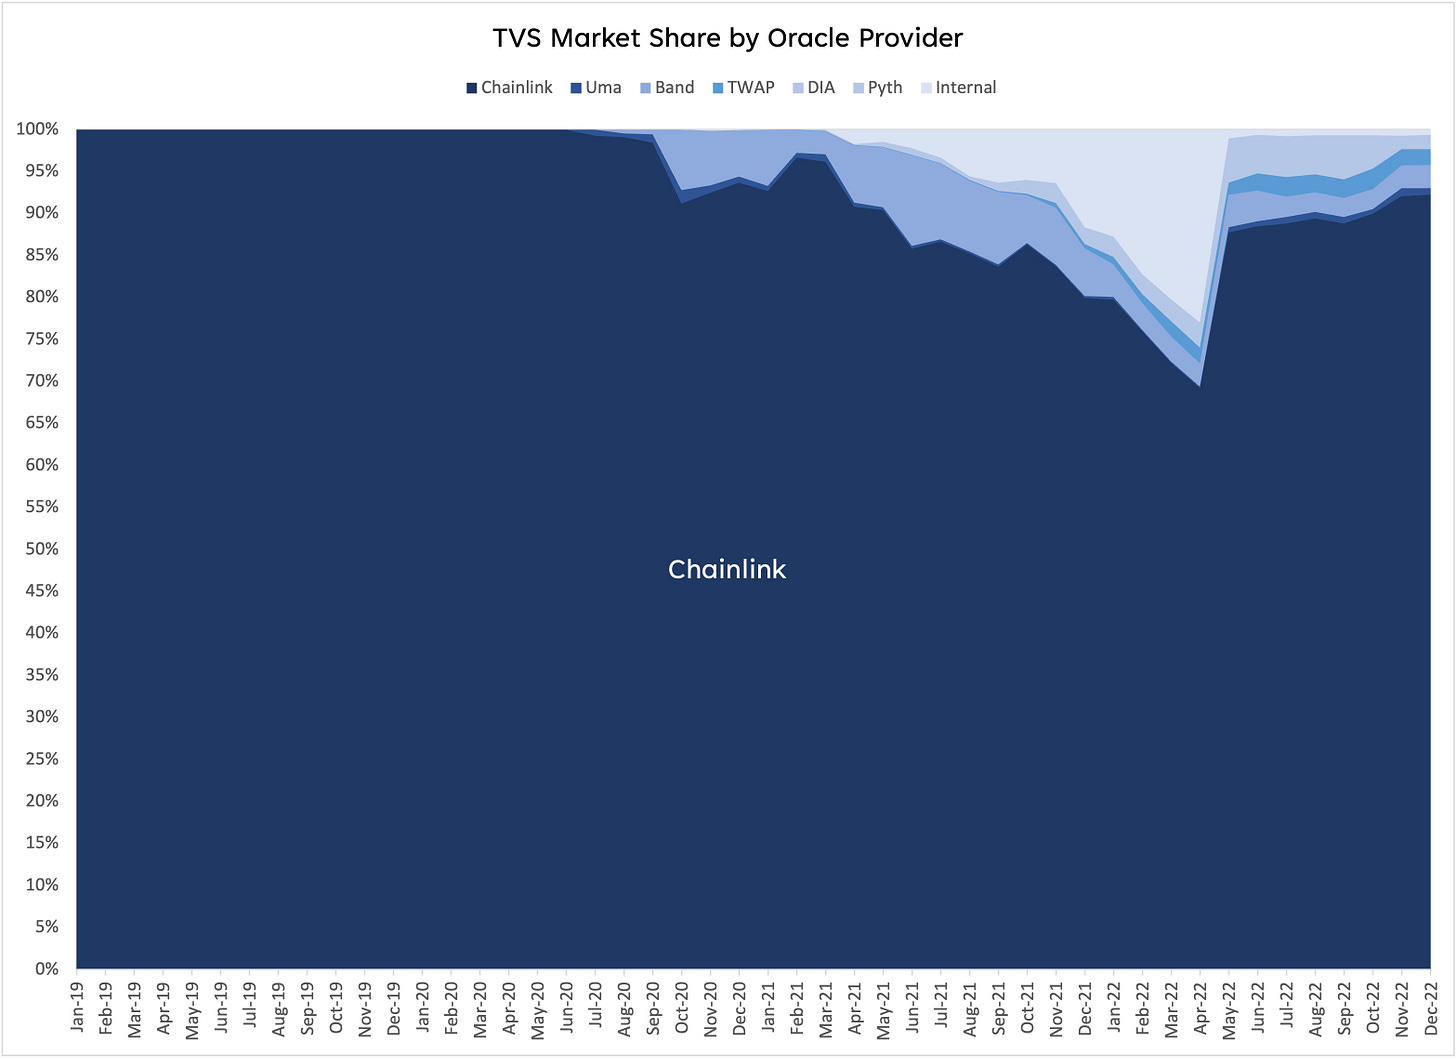
Market Dominance: Chainlink is the oracle provider for web3.
Chainlink’s share of oracle TVS is up 11% from 79% to 94% Y/Y.2
Chainlink secures 33x the value of its closest competitor, Band Protocol.
Chainlink secures 234 protocols, which is 2.6x more than its closest competitor, TWAP, and 6.3x more than Pyth.
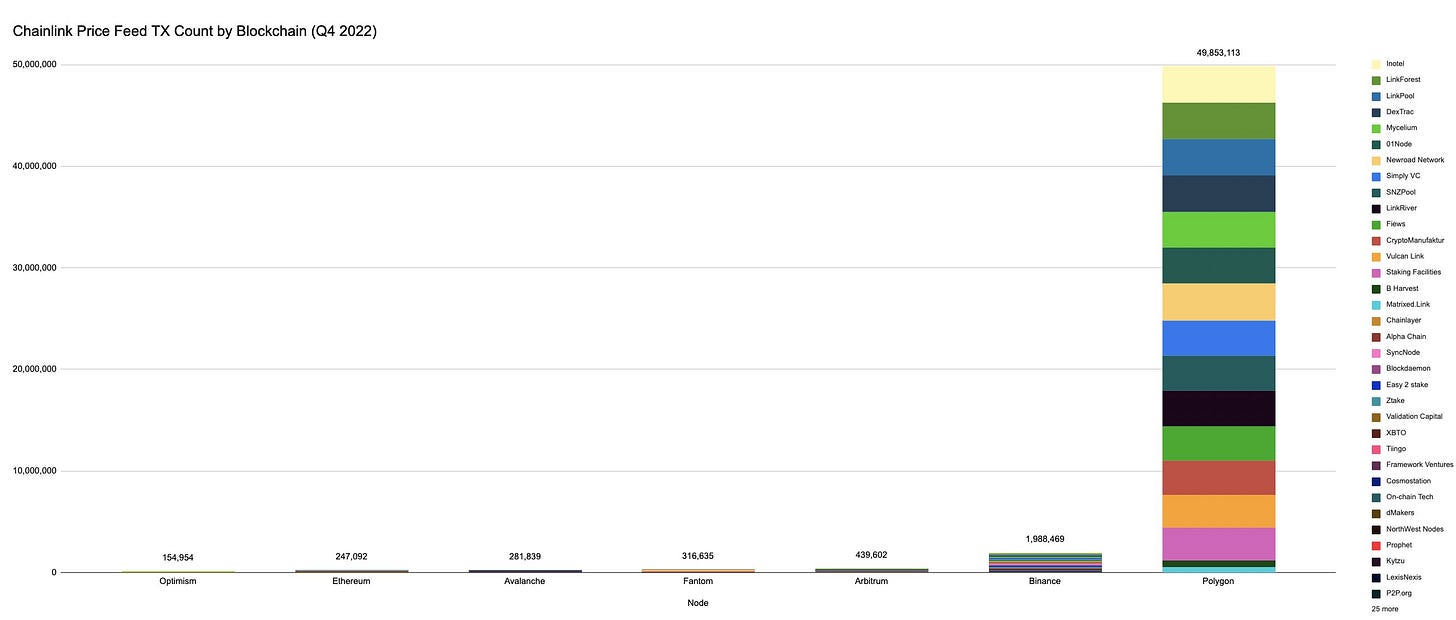
Price Feed Transactions: Despite total crypto transactions decreasing 13% Y/Y from 4.12bn to 3.56bn for Ethereum, Ethereum L2s, and EVM-compatible blockchains, Chainlink Price Feed TXs are up 172% Y/Y from 84 mm to 228mm transactions. (Including Solana, Chainlink Price Feeds TXs are up 244% Y/Y to 289mm.) Chainlink’s average share of total transactions for these blockchains increased from 2.04% to 6.41%, and Chainlink now represents 7.13% of all ETH L1, ETH L2, and EVM-compatible transactions, or 3.68% including Solana. Even while total BNB and Polygon network transactions are decreasing Q/Q, Chainlink continues to grow transactions in both absolute and relative terms:
Chainlink Price Feed TXs averaged 20% of all Polygon network TXs compared to 9% in FY21. Chainlink Price Feed TXs on Polygon are up 37% Y/Y despite total Polygon network transactions down 40% Y/Y.
Chainlink Price Feed TXs averaged 0.46% of all Binance TXs compared to 0.20% in FY21. Chainlink Price Feed TXs on BNB are up 33% Y/Y despite total BNB network TXs down 44% Y/Y.
Revenue Diversification: Ethereum’s share of Chainlink Network revenue declined from 91% to 54% Y/Y. Meanwhile, EVM-compatible blockchains are up from 8% to 39%, and Ethereum L2s are up from 1% to 7%. Polygon and BNB Chain now represent significant shares of Chainlink Network revenue – up from 4% and 5% respectively to 12% and 20%.
LINK 1.0 Valuation Outlook
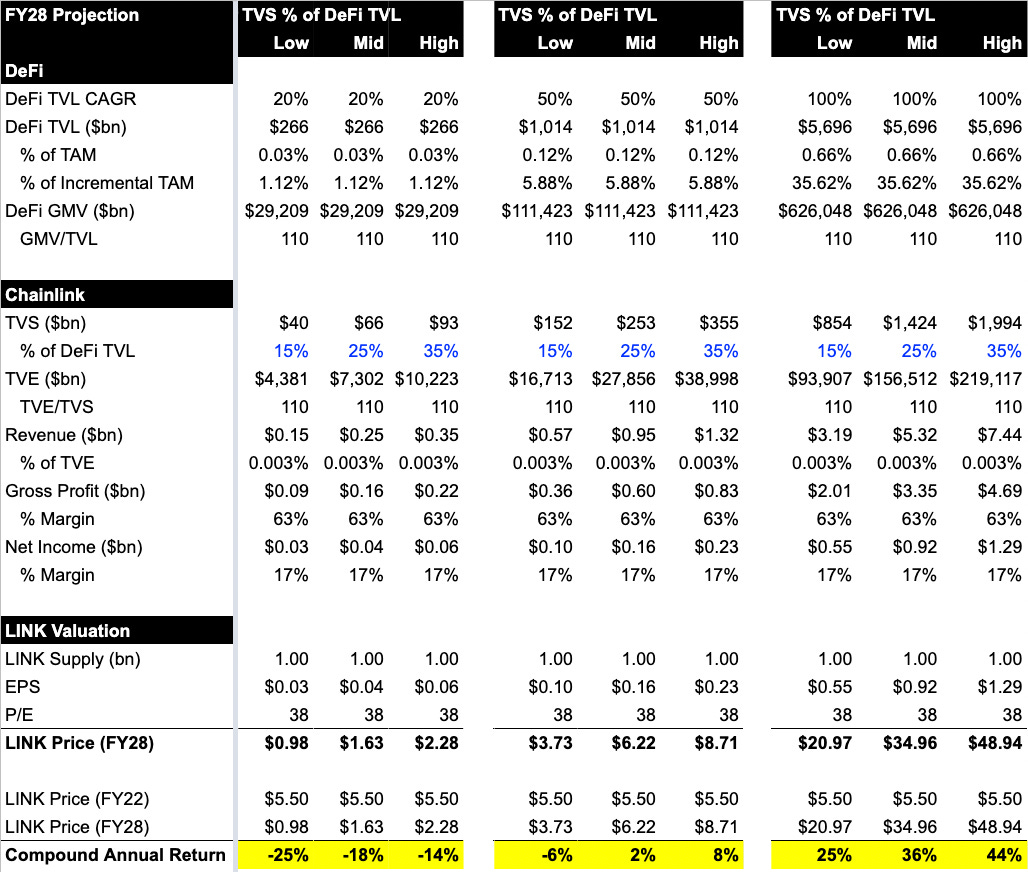
LINK/USD price is down 70% Y/Y to $6.05—its lowest since July 2020 and ~89% off its peak in May 2021. Assuming that net income margin and P/E multiple will eventually compare to Gartner, LINK price will only compound at 2%/year even if DeFi TVL grows at 50% CAGR over the next 6 years. This is due to (a) margin compression, (b) P/E compression, and (c) share dilution.3
The following shows the sensitivity of the valuation to assumptions about DeFi TVL growth and Chainlink’s market share among oracle providers. As to be expected, Chainlink will fare much better with a small share of a large TVL than a large share of a small TVL (i.e., LINK price = $20.97 at 15% of $5.70tn DeFi TVL vs. $2.28 at 35% of $266bn DeFi TVL).
My valuation models assume that Chainlink Network will generate revenue through a take rate on Transaction Value Enabled (TVE). I chose to do it that way because TVE is Chainlink Labs’ new “North Star Metric.” However, I think Chainlink will more likely earn a flat fee for Price Feed TXs on the number of TXs it facilitates (sort of like SWIFT). In this alternative model, long-term gross profit is a function of two parameters: (a) growth in TX count and (b) decay in GP/TX. As a comparison, SWIFT’s FIN message traffic has grown at 9% CAGR from 2.23B to 11.65B TXs/year from FY04 - FY22. Meanwhile, GP/TX has decayed at 8% from $0.18 to $0.04. See the valuation spreadsheet for my attempt.
LINK 2.0 Valuation Outlook
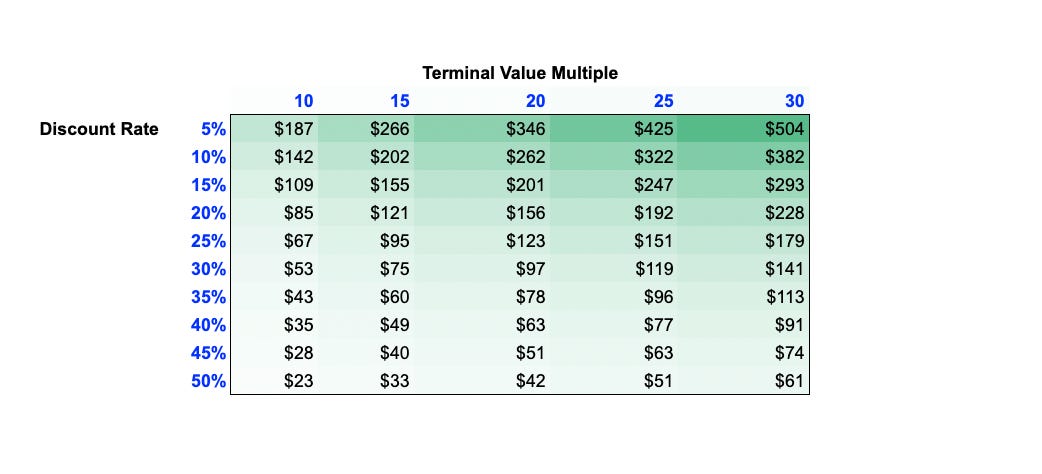
The LINK 2.0 valuation model estimates the present value of future staking cash flows. I take the growth assumptions from my LINK 1.0 model and tack on two extra assumptions with respect to (a) staking ratio and (b) price feed coverage ratio. I then estimate the DCF Present Value of LINK at $121.
My staking ratio is semi-arbitrary. The Chainlink 2.0 whitepaper states that the USD value of staked LINK should be ~1-5% of TVS, but that presupposes LINK price and runs into reflexivity problems. Ultimately, the valuation is highly sensitive to Staking Ratio, especially at lower percentages, as the present value of the terminal DCF value ranges from $103 (10% Staking Ratio) to $26 (40% Staking Ratio).4
Of course, the present DCF value is also highly sensitive to discount rate and terminal value multiple. But even at a 50% discount rate and 20x terminal value multiple, the present DCF value is still significantly higher than $6.05.
Appendix
Price Feeds: I analyze 597 price feeds across Ethereum (203), Polygon (105), BNB Chain (108), Fantom (27), Avalanche (53), Arbitrum (59), and Optimism (42). There are also 85 feeds across Moonriver (36), Harmony (23), Solana (12), Moonbeam (8), and Metis (6).
I exclude single-platform oracles—Maker and WINkLink (a fork of Chainlink).
The annual LINK issuance assumptions are based on Chainlink Labs moving 40.9mm LINK out of non-circulating wallets into circulation in H2 2022, which annualizes to 81.8mm LINK (8.18% of total supply).
Chainlink Staking: Chainlink Staking v0.1 (beta) went live on Ethereum mainnet on December 6, 2022.
Community Stakers: 22mm LINK (88%) was reserved for community stakers, who could stake anywhere from 1 to 7k LINK at a 4.75% yield in LINK. 7,891 unique LINK holders managed to fill the 25mm LINK (~$179mm at the time) pool within 3 days, and 2,330 (29.53%) staked the max 7k LINK.
Node Operators: 3mm LINK (12%) was reserved for 60 NOPs, who could each stake anywhere from 1k to 50k LINK at a 7.25% yield in LINK. 43 NOPs are collectively staking 1.45mm LINK directly in the Chainlink Staking contract.











so many numbers!!
This is as good as it get's for a valuation of Chainlink. We borrowed some of your metrics here for our internal thesis and valuation, specially given that Chainlink has gone fully fledged multi product since then