

Chainlink Network Financials and Valuation [1Q23 Update]

Disclaimer: Little of what I publish here is “final.” I open source 100% of my research and iterate publicly—whether it’s a Dune dashboard or a financial model—so that we can learn together. (See a complete guide to my public Dune queries/dashboards and spreadsheet models at the end.) Any and all input welcome!
Intro
Chainlink enables the creation of new types of decentralized applications and services by providing a secure, reliable, flexible, and scalable infrastructure for connecting off-chain data sources to on-chain smart contracts.
To that end, Chainlink offers a number of products:
Chainlink Data Feeds supply dApps with secure, reliable, and decentralized off-chain data.
Chainlink VRF supplies dApps with randomness for use in minting NFTs, distributing random rewards, etc.
Chainlink Automation enables dApps to outsource/automate smart contract transactions via Chainlink’s decentralized oracle network.
Chainlink Proof of Reserve (PoR) enables reliable and timely monitoring of reserve assets.
[BETA] Chainlink Cross-Chain Interoperability Protocol (CCIP) is a cross-chain messaging standard.
[BETA] Chainlink Functions is a serverless developer platform that enables fetching any data from any API and running custom compute on Chainlink's network.
Here, I focus on measuring the growth of Chainlink Price Feeds since the other products are largely speculative at the moment.
Executive Summary
KPIs
The Good
Transaction Value Secured (TVS) of $12B up 26% Q/Q.
TVS lead over 2nd place up from 33x to 35x.
Protocols Secured lead over 2nd place up from 2.6x to 3.4x.
Price Feed TXs up 8% Q/Q despite total TXs across relevant networks down 16% Q/Q.
Price Feed TXs captured share on Avalanche (+1.05%), Solana (+0.96%), Optimism (+0.58%), Fantom (+0.42%), and BNB Chain (+0.17%).
The Bad
Transaction Value Enabled of $0.59T down 21% Q/Q.
Integrations count of 90 down 38% Q/Q.
Price Feed TXs lost share on Arbitrum (-0.44%) and on Polygon (-0.14%).
Ethereum’s share of revenue up 9% Q/Q to 59%.
Earnings
The Good
Revenue of $12.59M up 36% Q/Q.
Gross Profit of $5.44M up 10% Q/Q.
Operating Profits of $2.67 up 25% Q/Q.
Net Income of $2.18M up 22% Q/Q.
The Bad
Cost of Goods Sold of $7.14M up 68% Q/Q.
Net Revenue Margin of 54% down 6% Q/Q.
Gross Profit Margin of 43% down 11% Q/Q.
Net Income Margin of 17% down 2% Q/Q.
DCF Price Target = $36

Key Performance Indicators (KPIs)
A key performance indicator (KPI) is a metric used to track the progress of an organization in achieving specific goals.
Integrations: Chainlink announced 64 integrations in 1Q23 and is on pace for 256 integrations in FY23. This would represent a 56% decline from FY21 and a 64% decline from FY21.
Developer Activity:
Active Developers: Chainlink is 8th overall in active developers. This is up 20% Q/Q but flat from from 1Q22.
Code Commits: Chainlink is 1st in code commits among non-L1s and 9th overall. This is up 18% Q/Q but flat from 1Q22.
Total Value Secured (TVS):
Chainlink TVS of $12B is up 26% Q/Q but down 78% from 1Q22.
DeFi TVL of $49B is up 26% Q/Q but down 70% from 1Q22.
Chainlink TVS / DeFi TVL of 24% is flat Q/Q but down 7% from 1Q22.
Transaction Value Enabled (TVE): TVE of $0.59T is down 21% Q/Q and 84% from 1Q22. Note: I critique Chainlink Labs’ calculation of TVE in [1], but it is likely directionally correct.

Earnings
Revenue for 1Q23 is $12.59M. This is up 36% Q/Q but down 73% from 1Q22.1 Note: Organic revenue is likely in the ~$1-5M range assuming 10-30% is subsidized by Chainlink Labs. NOPs also lose ~2% converting LINK to USDC

Cost of Goods Sold (COGS) for 1Q23 is $7.14M. This is up 68% Q/Q but down 68% from 1Q22.
Gas Costs for 1Q23 are $5.81M. This is up 57% Q/Q but down 74% from 1Q22.2
Gas Cost Reimbursements for 1Q23 are $0.16M. This is down 83% Q/Q and 86% from 1Q22. The reimbursement rate of 3% is down 23% Q/Q and 2% from 1Q22.
Gas Costs (Net of Reimbursements) are $5.65M. This is up 107% Q/Q but down 73% from 1Q22.
Data Costs are $1.49M. This is down 3% Q/Q but up 24% from 1Q22.

Gross Profit is $5.44M. This is up 10% Q/Q but down 78% from 1Q22.
Operating Expenses are $2.78M. This is down 2% Q/Q but up 6% from 1Q22.
Labor Costs are $2.01M. This is down 5% Q/Q and up 3% from 1Q22.
IT Infrastructure Costs are $0.77M. This is up 7% Q/Q and 15% from 1Q22.
Operating Profits are $2.67M. This is up 25% Q/Q but down 88% from 1Q22.
Net Income is $2.18M. This is up 22% Q/Q but down 87% from 1Q22.


Margins
Blended Net Revenue Margin (NRM) is 54%. This is down 6% Q/Q but up 1% from 1Q22.
Gainers
Ethereum NRM is 66%. This is up 3% Q/Q and 16% from 1Q22.
Fantom is 93%. This is up 3% Q/Q and 20% from 1Q22.
Losers
Polygon NRM is 15%. This is down 32% Q/Q and 12% from 1Q22.
Arbitrum NRM is 61%. This is down 20% Q/Q but up 71% from 1Q22.
Binance NRM is 44%. This is down 11% Q/Q and 15% from 1Q22.
Optimism NRM is 41%. This is down 8% Q/Q and down 47% from 1Q22.
Avalanche NRM is 91%. This is down 3% Q/Q but up 18% from 1Q22.
Blended Gross Profit Margin is 43%. This is a decrease of 11% Q/Q and 10% from 1Q22.
Blended Net Income Margin is 17%. This is a 2% decrease Q/Q and 19% from 1Q22.


Silver Linings: Revisited
Market Dominance: Chainlink is the oracle provider for web3.
Chainlink’s share of oracle TVS is 91%.2
Chainlink secures 35x the value of its closest competitor, Band Protocol, extending its lead from 33x in 4Q22.
Chainlink increased the number of protocols it secures from 234 to 261, extending its lead over its closest competitor, TWAP, from 2.6x to 3.4x.

Price Feed TXs
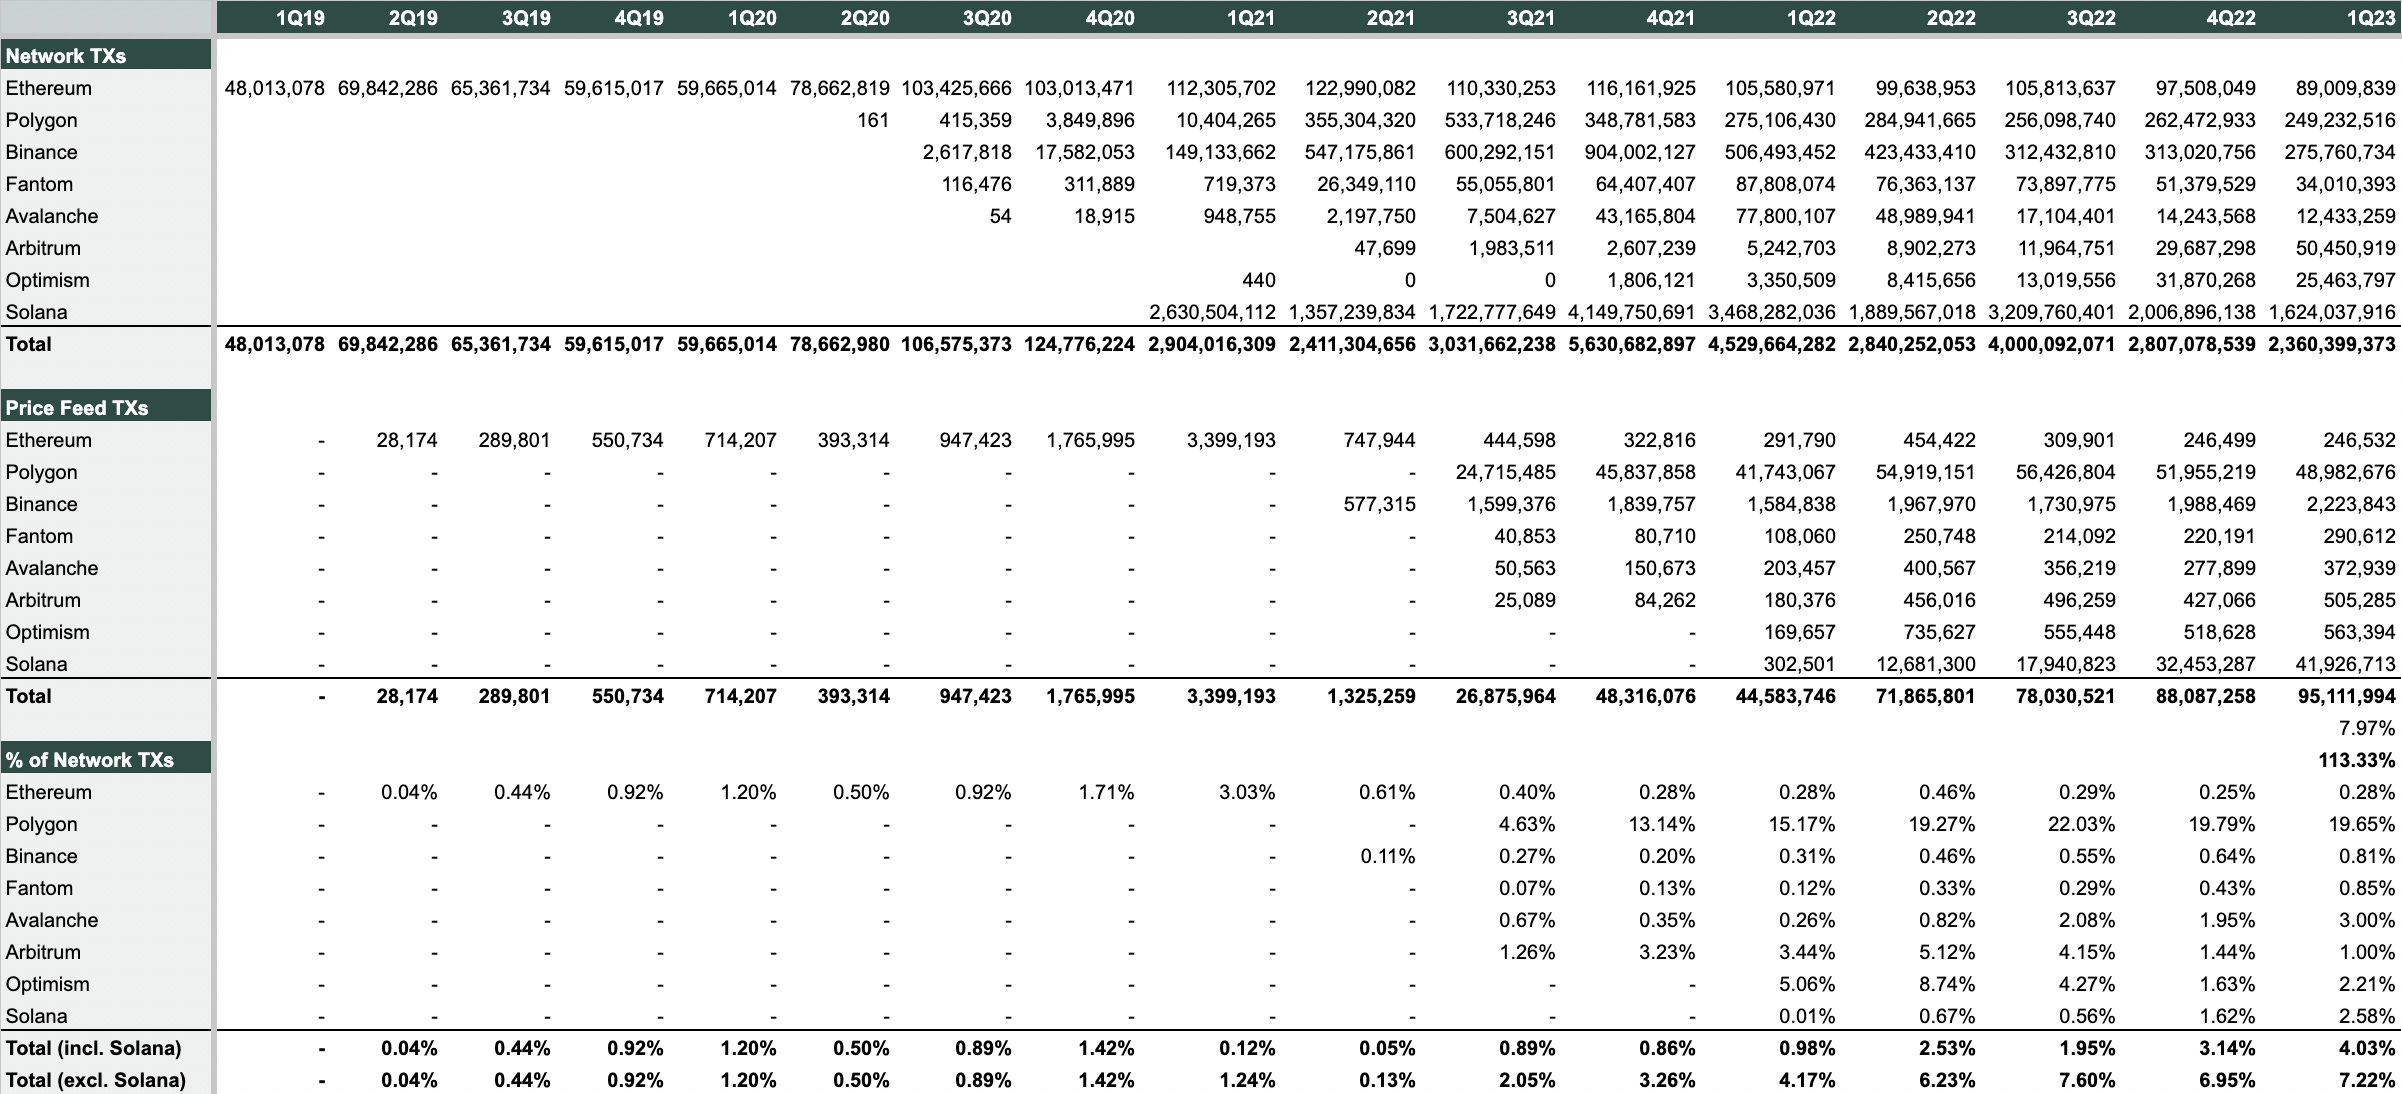
In 1Q23 there were 2.36B total crypto TXs across Ethereum, relevant Ethereum L2s, relevant EVM-compatible blockchains, and Solana. This is down 16% Q/Q and 48% from 1Q22.
Nevertheless, Chainlink Price Feed TXs are up 8% Q/Q and 113% from 1Q22. They now represent 7% of all TXs on relevant networks excluding Solana and 4% of all TXs including Solana.
Gainers:
Avalanche: Chainlink Price Feed TXs are up 1.05% Q/Q and 2.74% from 1Q22. They now represent 3.00% of all Avalanche TXs.
Solana: Chainlink Price Feed TXs are up 0.96% Q/Q and 2.57% from 1Q22. They now represent 2.58% of all Solana TXs.
Optimism: Chainlink Price Feed TXs are up 0.58% Q/Q but down 2.85% from 1Q22. They now represent 2.85% of all Optimism TXs.
Fantom: Chainlink Price Feed TXs are up 0.42% Q/Q and 0.73% from 1Q22. They now represent 0.85% of all Fantom TXs.
BNB: Chainlink Price Feed TXs are up 0.17% Q/Q and 0.50% from 1Q22. They now represent 0.81% of all BNB TXs.
Ethereum: Chainlink Price Feed TXs are up 0.01% Q/Q but down 15.51% from 1Q22. They now represent 0.28% of all Ethereum TXs.
Losers:
Arbitrum: Chainlink Price Feed TXs are down 0.44% Q/Q and 2.44% from 1Q22. They now represent 1.00% of all Arbitrum TXs.
Polygon: Chainlink Price Feed TXs are down 0.14% Q/Q but up 4.48% from 1Q22. They now represent 19.65% of all Polygon TXs.
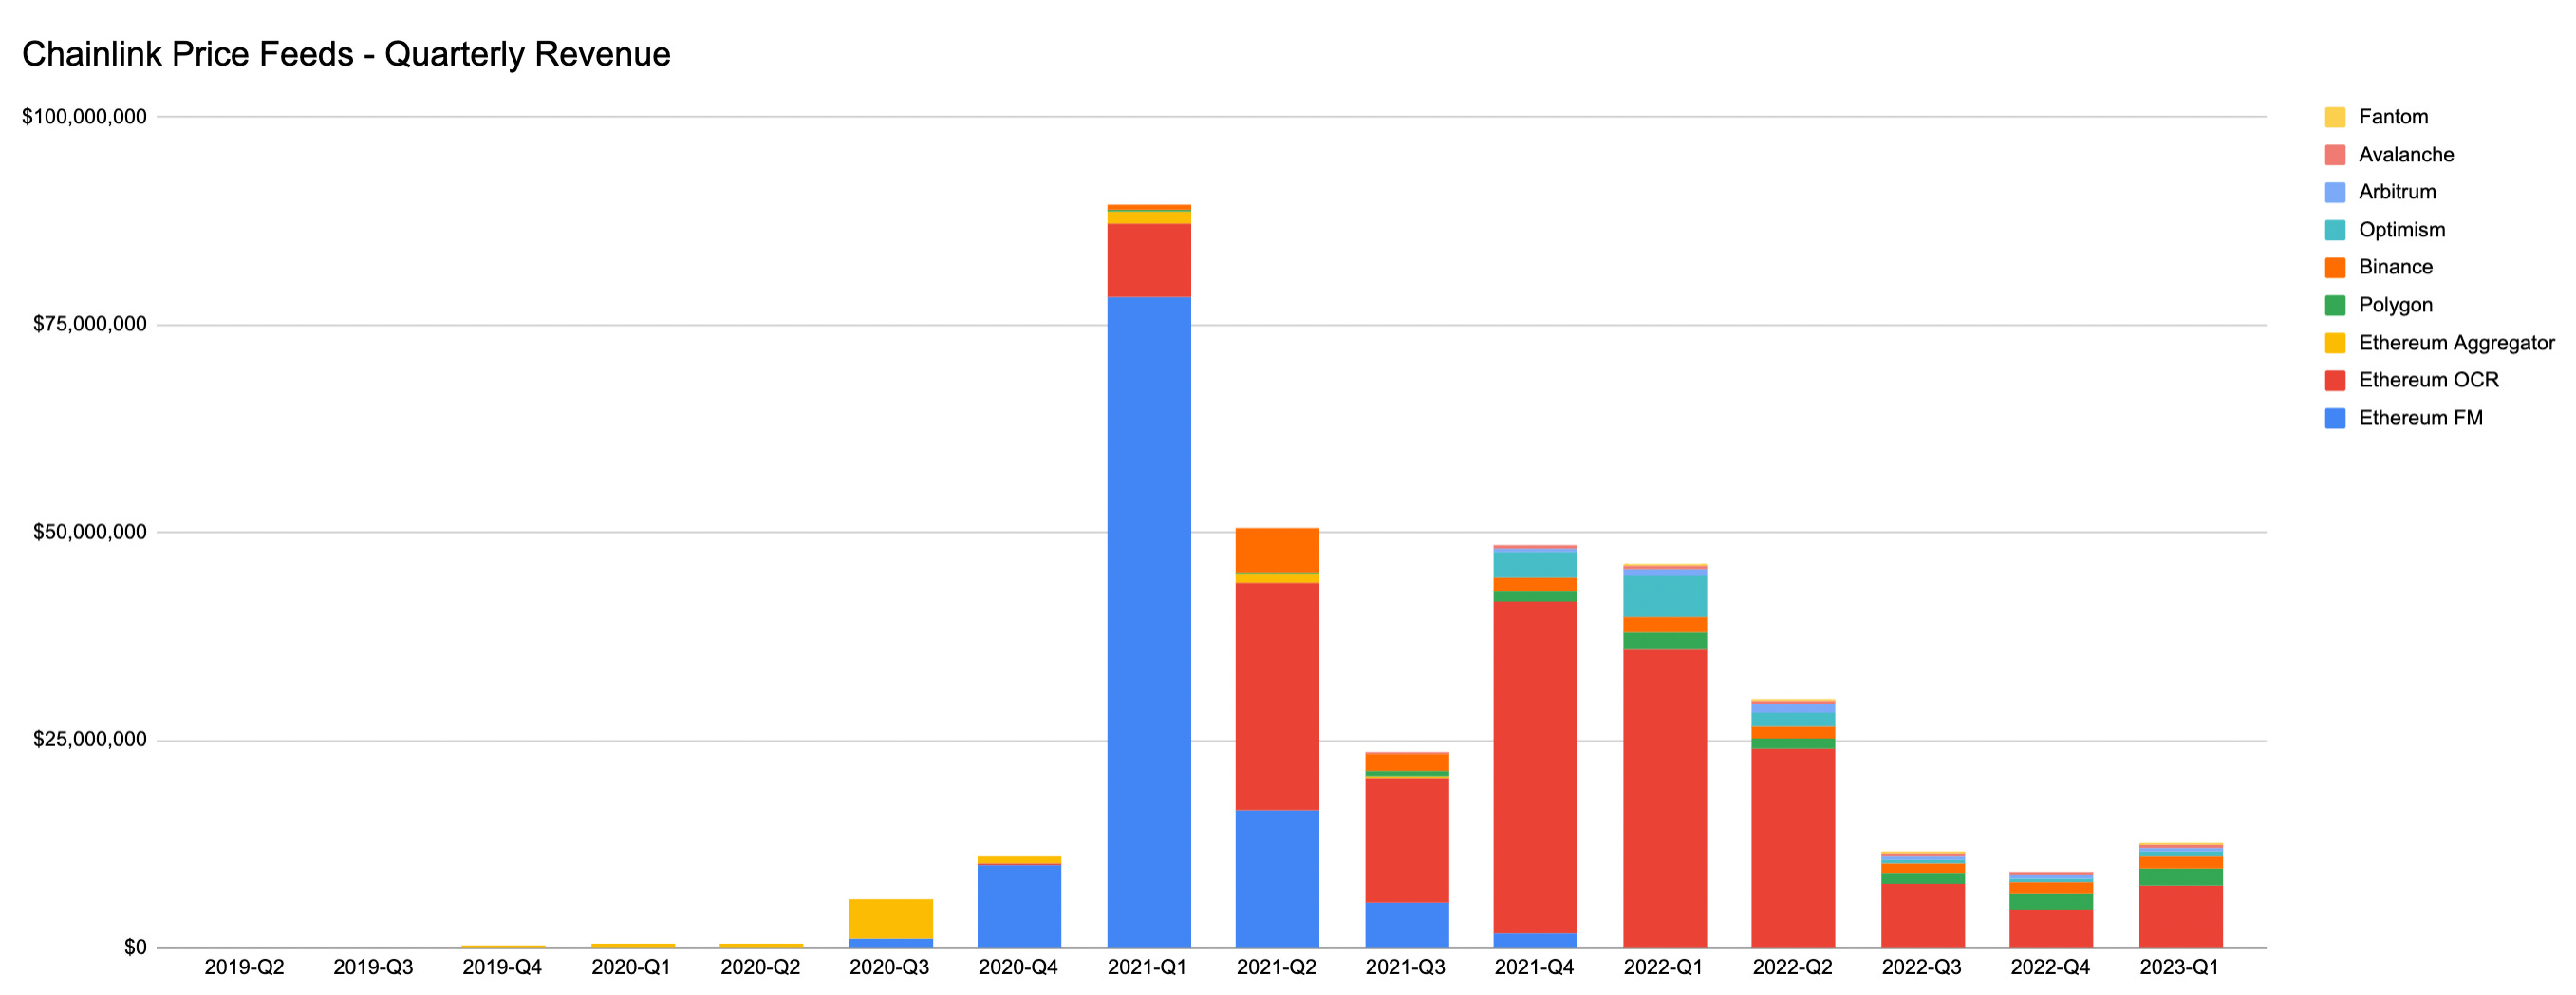
Revenue Diversification: Chainlink Network revenue reconsolidated to Ethereum from EVM-compatible blockchains and Ethereum L2s in 1Q23; however, cross-chain revenue diversification is still much improved over 1Q22.
Revenue
Ethereum represented 59% of revenue in 1Q23. This is up 9% Q/Q but down 19% from 1Q22.
EVM-compatible blockchains represented 33% of revenue in 1Q23. This is down 9% Q/Q but up 23% from 1Q22.
Ethereum L2s represented 8% of revenue in 1Q23. This is flat Q/Q and down 4% from 1Q22.
Net Revenue (Revenue - Gas Costs)
Ethereum represented 71% of net revenue in 1Q23. This is up 19% Q/Q but down 3% from 1Q22.
EVM-compatible blockchains represented 21% of net revenue in 1Q23. This is down 18% Q/Q but up 13% from 1Q22.
Ethereum L2s represented 7% of net revenue in 1Q23. This is down 2% Q/Q and 10% from 1Q22.

LINK 2.0 Valuation Outlook
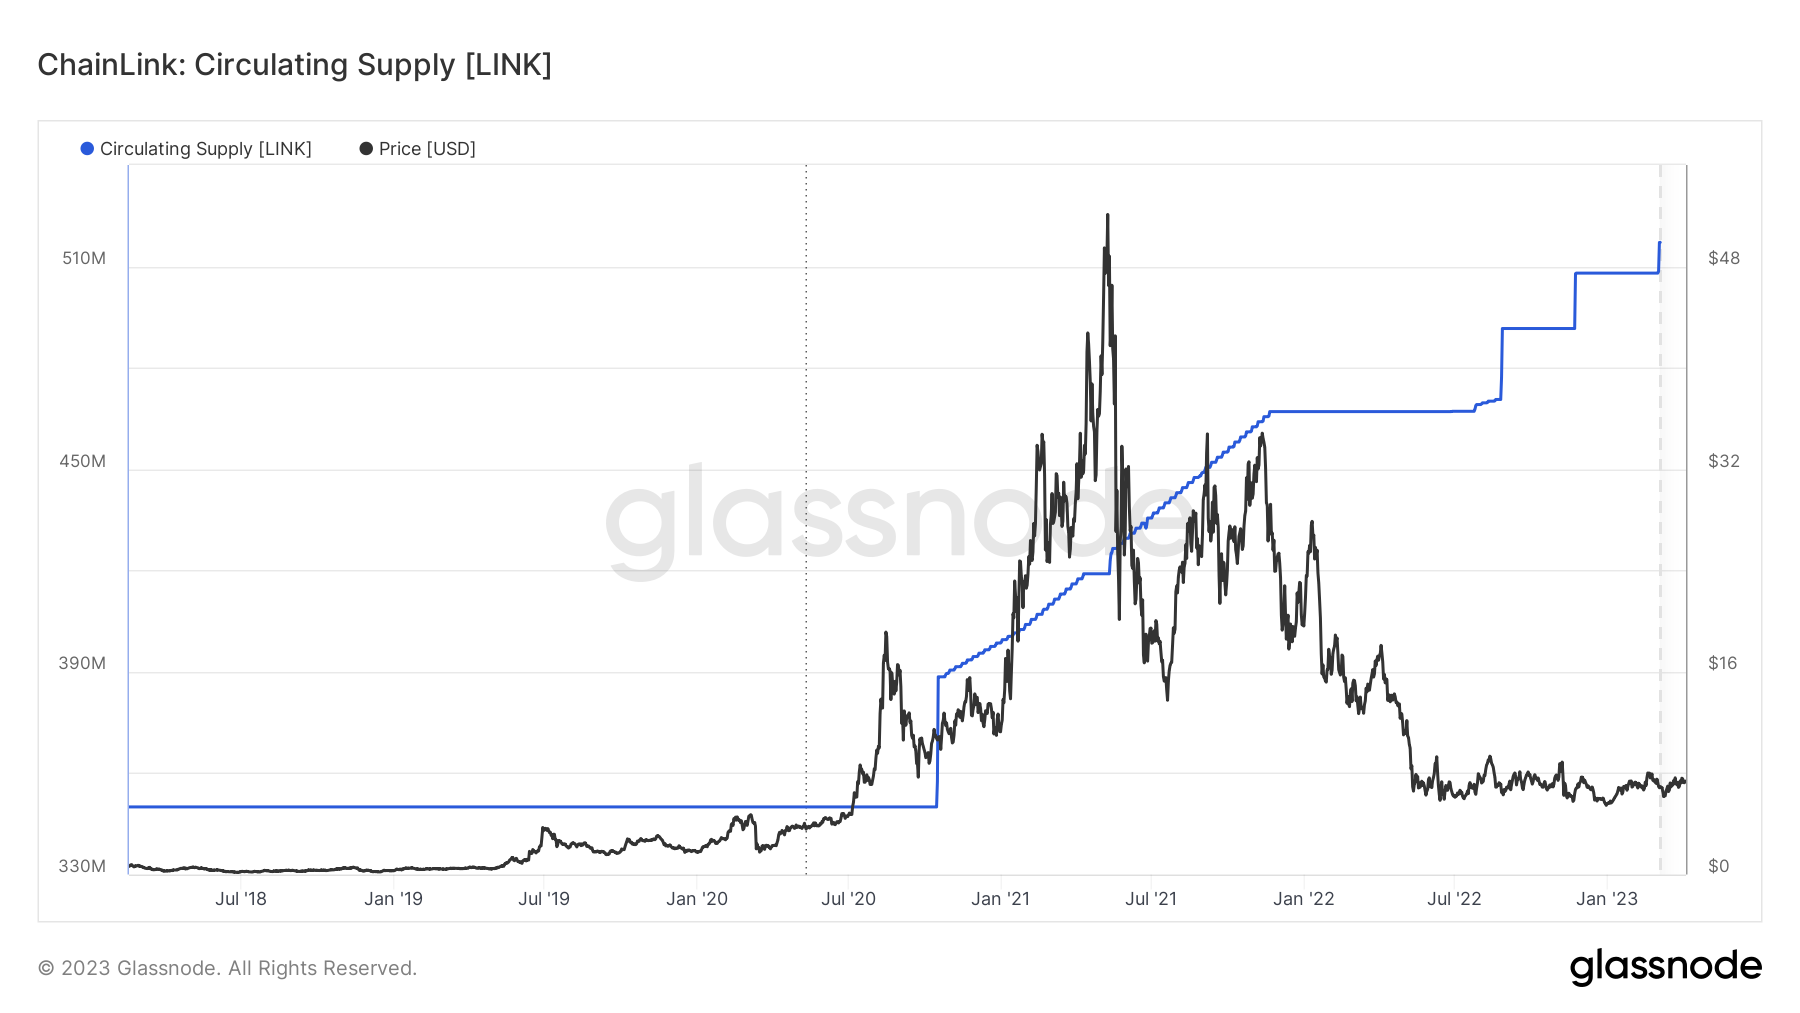
Intro: LINK price ended 1Q23 at $7.24. This is up 32% Q/Q but down 42% from 1Q22 and 87% off its high in FY21.
Methodology: My LINK 2.0 valuation model estimates the present value of LINK based on future cash flows expected to accrue to LINK via staking. It incorporates cash flows from (a) Chainlink Price Feeds and (b) Chainlink BUILD startup equity.
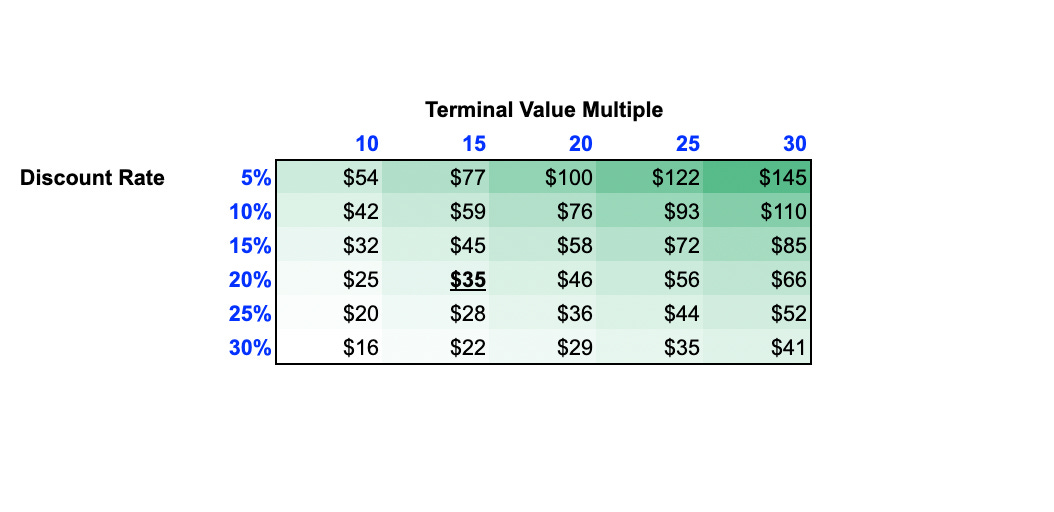
Discounted Cash Flow (DCF) Present Value: The DCF Present Value reflects the value of LINK today based on estimates of its future income and expenses. I estimate the DCF Present Value of LINK at ~$35. This means you can pay $7 to get $35 of value.
Assumptions:
DeFi TVL grows at a 50% CAGR.
TVE/TVS mirrors DeFi GMV/TVL, and DeFi GMV/TVL stays constant at 110.
Oracle TVS/DeFi TVL stays constant at 31%.
Revenue/TVE stays constant at 0.004%.
Gross Profit Margins increase from 43% to 63% in line with Gartner.
Assumptions:
Staking Ratio increases from 4% to 60% by FY28.
Price Feed Coverage (% of Gross Profit) increases from 3% to 100% by FY28.
BUILD partnerships increase at 29% CAGR.
Median crypto startup valuation stays constant at $20M.
Chainlink Network receives 2% of BUILD partner startup equity.


Note on Discount Rate: High-risk assets require higher returns to compensate for the additional risk. I use a 20% discount rate in the above model, which is common for investments associated with higher levels of risk, uncertainty, and volatility like early-stage startups, speculative investments, or distressed assets. However, I also provide a sensitivity table given the challenge of determining a required rate of return for a high-risk crypto asset like LINK.

Holding terminal value multiple constant at 15x, the DCF Present Value ranges from $23 at a 30% discount rate to $59 at a 10% discount rate.
Holding discount rate constant at 20%, the DCF Present Value ranges from $25 at a 10x terminal value multiple to $66 at a 30x terminal value multiple.
Note on Staking Ratio: The DCF Present Value is sensitive to the terminal Staking Ratio in FY28 because a higher Staking Ratio necessarily implies lower GP + Build Equity Value / LINK staked assuming Gross Profit and Build Equity Value are independent of Staking Ratio. For instance, the DCF Present Value drops to $27 assuming an FY28 Staking Ratio of 80%, and it increases to $53 assuming an FY28 Staking Ratio of 40%. For a benchmark, the weighted-average Staking Ratio for PoS networks is ~40%, but that number is superficially low due to Ethereum.

Note on Subsidies: Incorporating Chainlink Labs' subsidies into the DCF model can provide a more accurate estimate of the value of LINK earned by Chainlink Node Operators and distributed to LINK token holders. While my initial intuition was to apply a 70-90% discount to revenue and recalculate Chainlink Network gross profit, I now believe the impact of subsidies on the DCF Present Value is captured by the dilutionary effect of increases to the circulating LINK supply (from which Chainlink Labs finances these subsidies). Additionally, Chainlink is starting to (a) monetize without subsidies (see: GMX V2) and (b) issue less LINK (to finance subsidies).
Resources
[Dune Queries and Dashboards]: The data in my Chainlink Node Operator Financials spreadsheet (and used in my LINK 2.0 valuation model) comes from my 200+ Chainlink-related queries on Dune Analytics.
Revenue: Ethereum OCR Revenue | Ethereum FM Revenue | Ethereum Aggregator Revenue | Ethereum Aggregator Revenue 2 | Polygon Revenue | Binance Revenue | Optimism Revenue | Arbitrum Revenue | Avalanche Revenue | Fantom Revenue.
Gas Costs: Ethereum OCR Gas Costs | Ethereum FM Gas Costs | Ethereum Aggregator Gas Costs | Ethereum Aggregator Gas Costs | Polygon Gas Costs | Binance Gas Costs | Optimism Gas Costs | Arbitrum Gas Costs | Avalanche Gas Costs | Fantom Gas Costs | Solana Gas Costs.
Gas Cost Reimbursements: Gas Cost Reimbursements [Low] | Gas Cost Reimbursements [High].
TX Counts: Ethereum OCR TXs | Ethereum FM TXs | Ethereum Aggregator TXs | Polygon TXs | BNB Chain TXs | Optimism TXs | Arbitrum TXs | Avalanche TXs | Fantom TXs | Solana TXs.
Other: LINK Holders Categorized.
[Spreadsheet]: Chainlink Node Operator Financials
My Chainlink Node Operator Financials spreadsheet is the only complete source of historical Chainlink Network Price Feed revenue, gas costs, and gas cost reimbursements.
The dataset spans from 2019-2023 and tracks 59 node operators (NOPs) across Ethereum OCR, Ethereum FM, Ethereum Aggregator, Polygon, BNB Chain, Fantom, Avalanche, Optimism, Arbitrum, and Solana.
The dataset also includes estimates of NOPs’ off-chain data subscription costs and operating expenses (IT staff, IT infrastructure, and hardware depreciation), which is used to approximate net income.
[Spreadsheet]: Chainlink Valuation Models
My Chainlink Valuation Model spreadsheet contains several attempts at measuring the (discounted) present value of LINK by forecasting future Chainlink Network cash flows from Chainlink Price Feeds and Chainlink BUILD. The models use data from the Chainlink Node Operator Financials spreadsheet.
I exclude Chainlink Price Feed data for Solana (other than TXs), HECO, Moonriver, Harmony, Metis, Moonbeam, Gnosis. I also exclude Chainlink VRF and Automation.
I report USD-equivalent figures, but in reality NOPs spent 1,801 ETH ($2.84M), 1,413,828 MATIC ($1.69M), 2,510 BNB ($0.76M), 1,985 AVAX ($0.03M), and 23,247 FTM ($0.01M). See the Chainlink Node Operator Financials spreadsheet.
It will be nice if we have an updated numbers for 2024 as RWA could change Chainlink performance. Great article anyway.
This is as good as it get's for a valuation of Chainlink. We borrowed some of your metrics here for our internal thesis and valuation, specially given that Chainlink has gone fully fledged multi product since then