Modeling Web3 Gaming Revenue Pools

Intro
Overview: A number of traditional game publishers (e.g., Com2Us Studios) are now incorporating elements of web3 tech into their existing portfolios, typically in very limited ways. This includes NFTs and crypto payments, since blockchain technology can replace standard in-game microtransaction infrastructure. Tldr; Cryptocurrencies replace in-game currency, NFTs represent additional in-game products (e.g., expansion or content packs, power-ups, etc.), and cryptocurrency wallets handle user inventory.
Microtransactions: A microtransaction is the exchanging of real-world or in-game currency for any additional service or product either within a video game or through an external marketplace such as the App Store. This includes expansion or content packs, power-ups, time-savers, playable characters, cosmetics or skins, and loot boxes.
The purpose of this exercise is not necessarily to project future web3 gaming revenue with a high degree of accuracy (impossible), but to get a sense of where the value will accrue, and to compare that with traditional gaming. Feel free to play with my revenue models here.
Global Gaming Microtransactions TAM
Global Digital Gamers: Global Digital Gamers will increase at a 2.65% CAGR from 2.47B to 3.04B by FY30 [1]. Their share of global internet users will increase from 32% to 36%, while their share of the global population will remain roughly constant at 47% [2].
Digital Gaming Market: Spending by Digital Gamers will increase at a 5.53% CAGR from $194B in FY22 to $299B by FY30 [3]. The spending will come from global E&M, which will increase at a 3.47% CAGR from $2.51T to $3.30T by FY30 [4]. The digital gaming segment will increase modestly from 8% to 9% of global E&M.
Digital Gaming Microtransaction Market: Spending by Digital Gamers on in-game microtransactions will increase at a 9.34% CAGR from $68B in FY22 to $138B by FY30 [5]. Microtransactions will increase as a percentage of digital gamer spending from 34% to 46%. Their share of global E&M spending will increase slightly from 3% to 4%. Annual microtransaction ARPU will increase from $27 to $46, slightly higher than e.g., Meta’s current advertising ARPU of $41.

Web3 Gaming Microtransactions TAM
Web3 Gamers
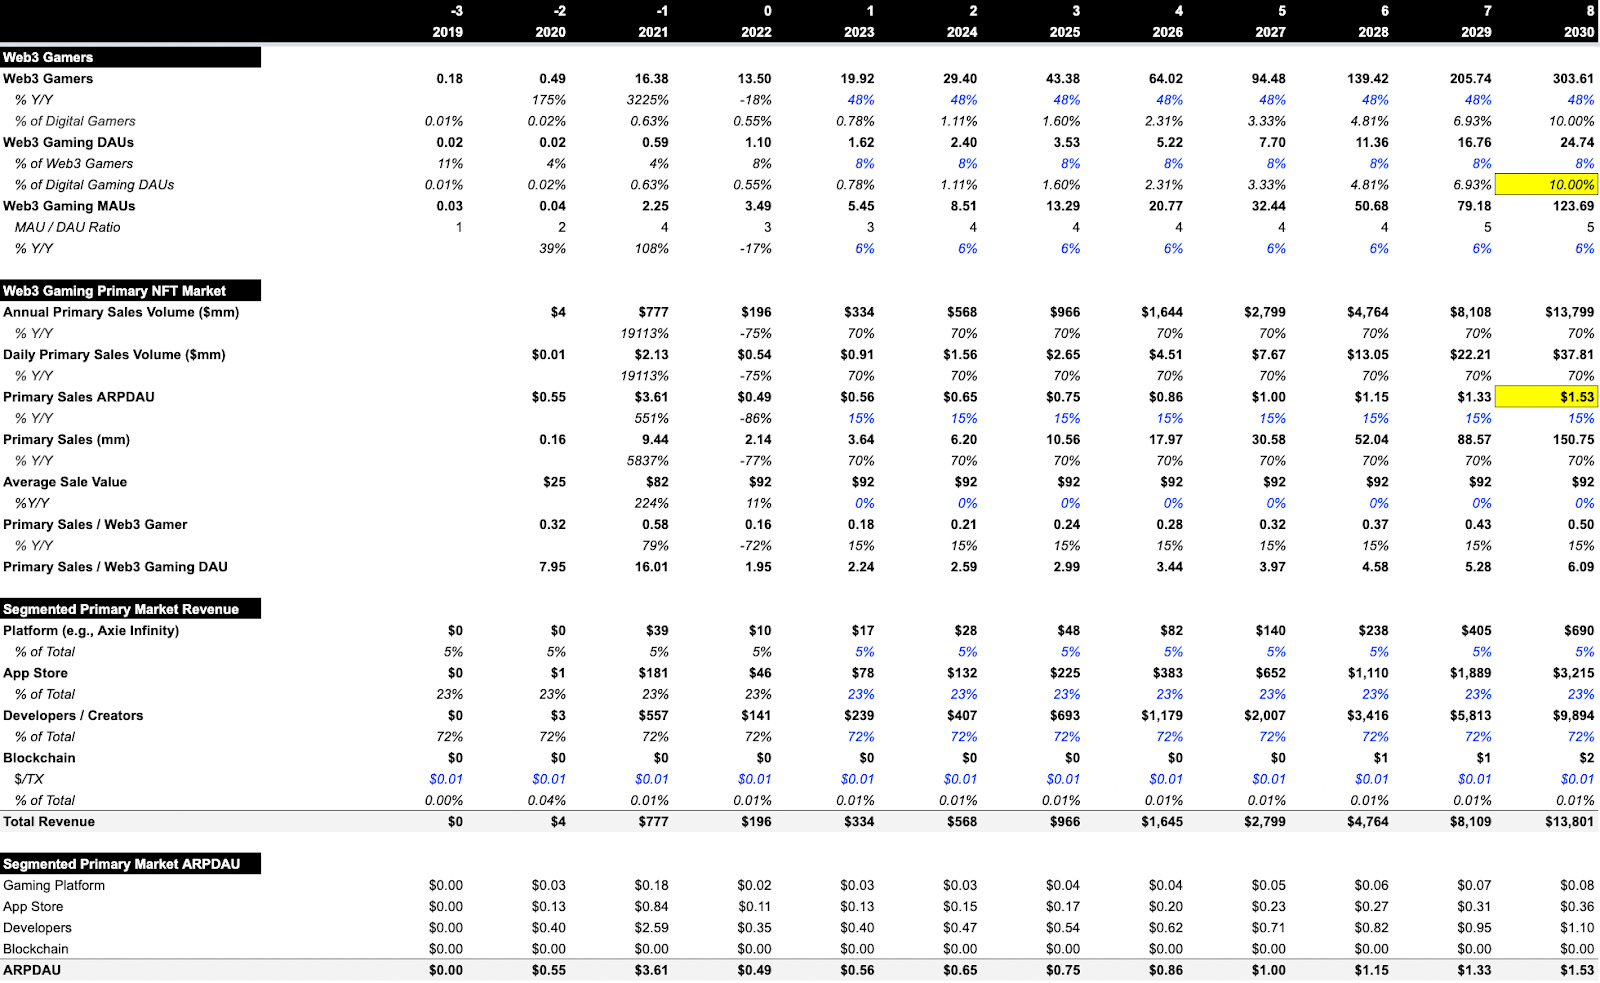
Average web3 gaming DAUs increased ~86% Y/Y from 0.59M to 1.10M while total web3 gamers decreased ~18% Y/Y from 16.38M to 13.50M [6]. The increase in web3 gaming DAUs / total web3 gamers from 3.60% to 8.15% shows an improvement in web3 gamer conversion.
My model assumes that total Web3 gamers will increase at a 48% CAGR from 14M in FY22 to 304M in FY30. Assuming a constant ~8% of web3 gamers convert to web3 gaming DAUs, web3 gaming DAUs will increase from 1.10M to 24.74M. This implies an increase in penetration from <1% to 10% of global digital gaming DAUs and should equate to growth in web3 gaming MAUs from 3.49M to 124M assuming the MAU/DAU ratio trends toward the standard ~5x.
My growth assumptions seem semi-reasonable: (a) global internet users grew at a 71% CAGR from 3M to 188M from FY90 to FY98 and (b) cloud gamers are projected to reach 87M by FY25, which would imply a 71% CAGR since FY18 when there were only 2M cloud gamers [7].
Primary Market
Annual primary gaming NFT sales volume is currently $196M on 2.14M sales [8]. Assuming web3 gaming ARPDAU increases at a 15% CAGR to $1.53–on par with the global digital gaming sector–I expect web3 gamers will spend $14B per year in the primary market by FY30. This will equate to 151M in annual primary sales assuming the average sales value stays constant at $92.
Annual spending per web3 gamer will increase from $12 on 0.13 items to $67 on 0.73 items, while annual spending per web3 gaming DAU will increase from $332 on 3-4 items to $823 on 9 items.
Content creators/developers will earn $9.90B (72%), app stores will earn $3.22B (23%), gaming platforms will earn $690M (5%), and blockchain settlement platforms will earn $2M (0.01%) [9].
Note: I expect that gaming platforms will largely double as the content creators/developers, which would imply that they can earn up to 79% of primary sales revenue.
Secondary Market
The existence of open secondary markets is a novel innovation of web3, and its trajectory is hard to predict due to lack of precedent. One possible method is forecasting secondary sales based on my primary sales projection.
Annual secondary gaming NFT sales volume is currently $1.03B on 5M sales [10]. The ratio of secondary sales to primary sales is 2.33x. Given primary sales of 151M in FY30 we can therefore expect secondary sales to increase from 5M to 352M by FY30. Annual secondary sales volume will increase from $1B to $73B by FY30 assuming the average sales value stays constant at $206, which will drive an increase in secondary sales revenue from $77M to $5.45B.
Web3 gamers will increase their annual spending from $76 on 0.37 items to $239 on 1.16 items, while web3 gaming DAUs will increase their annual spending from $937 on 4.54 items to $2933 on 14.22 items. Accordingly, secondary sales ARPU will increase from $5.73 to $17.93, and ARPDAU will increase from $0.19 to $0.60 ARPDAU.
Gaming platforms will capture $3.63B (5%), creators/developers will capture $1.81B (2.5%), and blockchain platforms will capture $4M (0.06%).

Currency Market
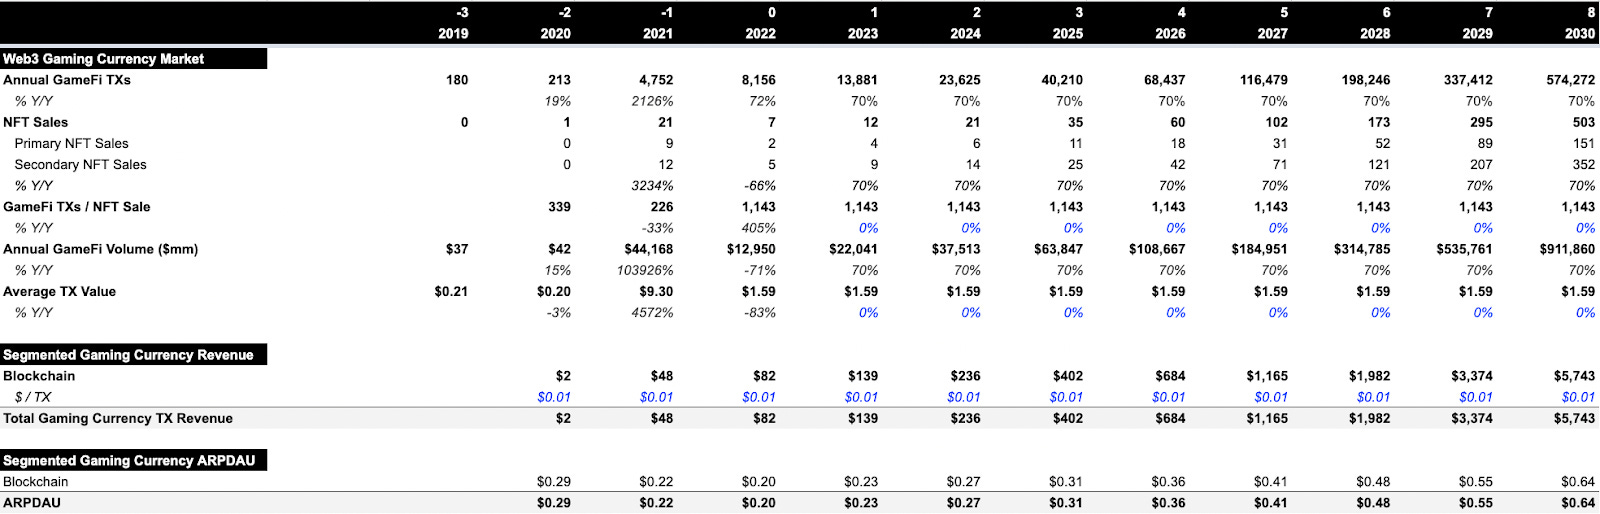
As mentioned in the intro, blockchain technology enables games to replace their in-game currencies with cryptocurrencies. Projecting the number of in-game currency transactions is even more challenging than secondary sales. First, I extrapolate annual GameFi transactions and volume from the ratio of GameFi transactions to NFT sales. In FY22, there were ~8B TXs compared to 7M gaming NFT sales, which implies 1,143 currency transactions per NFT sale.
Assuming the ratio of transactions to NFT sales stays constant at 1,143x then annual web3 gaming transactions will increase from 8B to 575B by FY30. If the average transaction value stays constant at $1.59 then volume will increase from $13B to $912B.
This implies that annual currency TXs will increase from 604 ($1K in volume) to 1,891 ($3K in volume) per web3 gamer, or 7,414 ($12K in volume) to 23,213 ($37K in volume). ARPDAU will increase from $0.20 to $0.64, while ARPU will increase from $6.04 to $18.91.
Blockchains will capture $5.75B in revenue assuming they charge $0.01 per transaction.
Alternatively, holding TXs / DAU constant at 7,414x and TX value constant at $1.59 implies an increase in TXs from 8B to 183B and in volume from $13B to $291B, which would imply blockchain platform revenue of $1.83B. This method projects 32% lower transactions, volumes, and revenues.
Conclusion
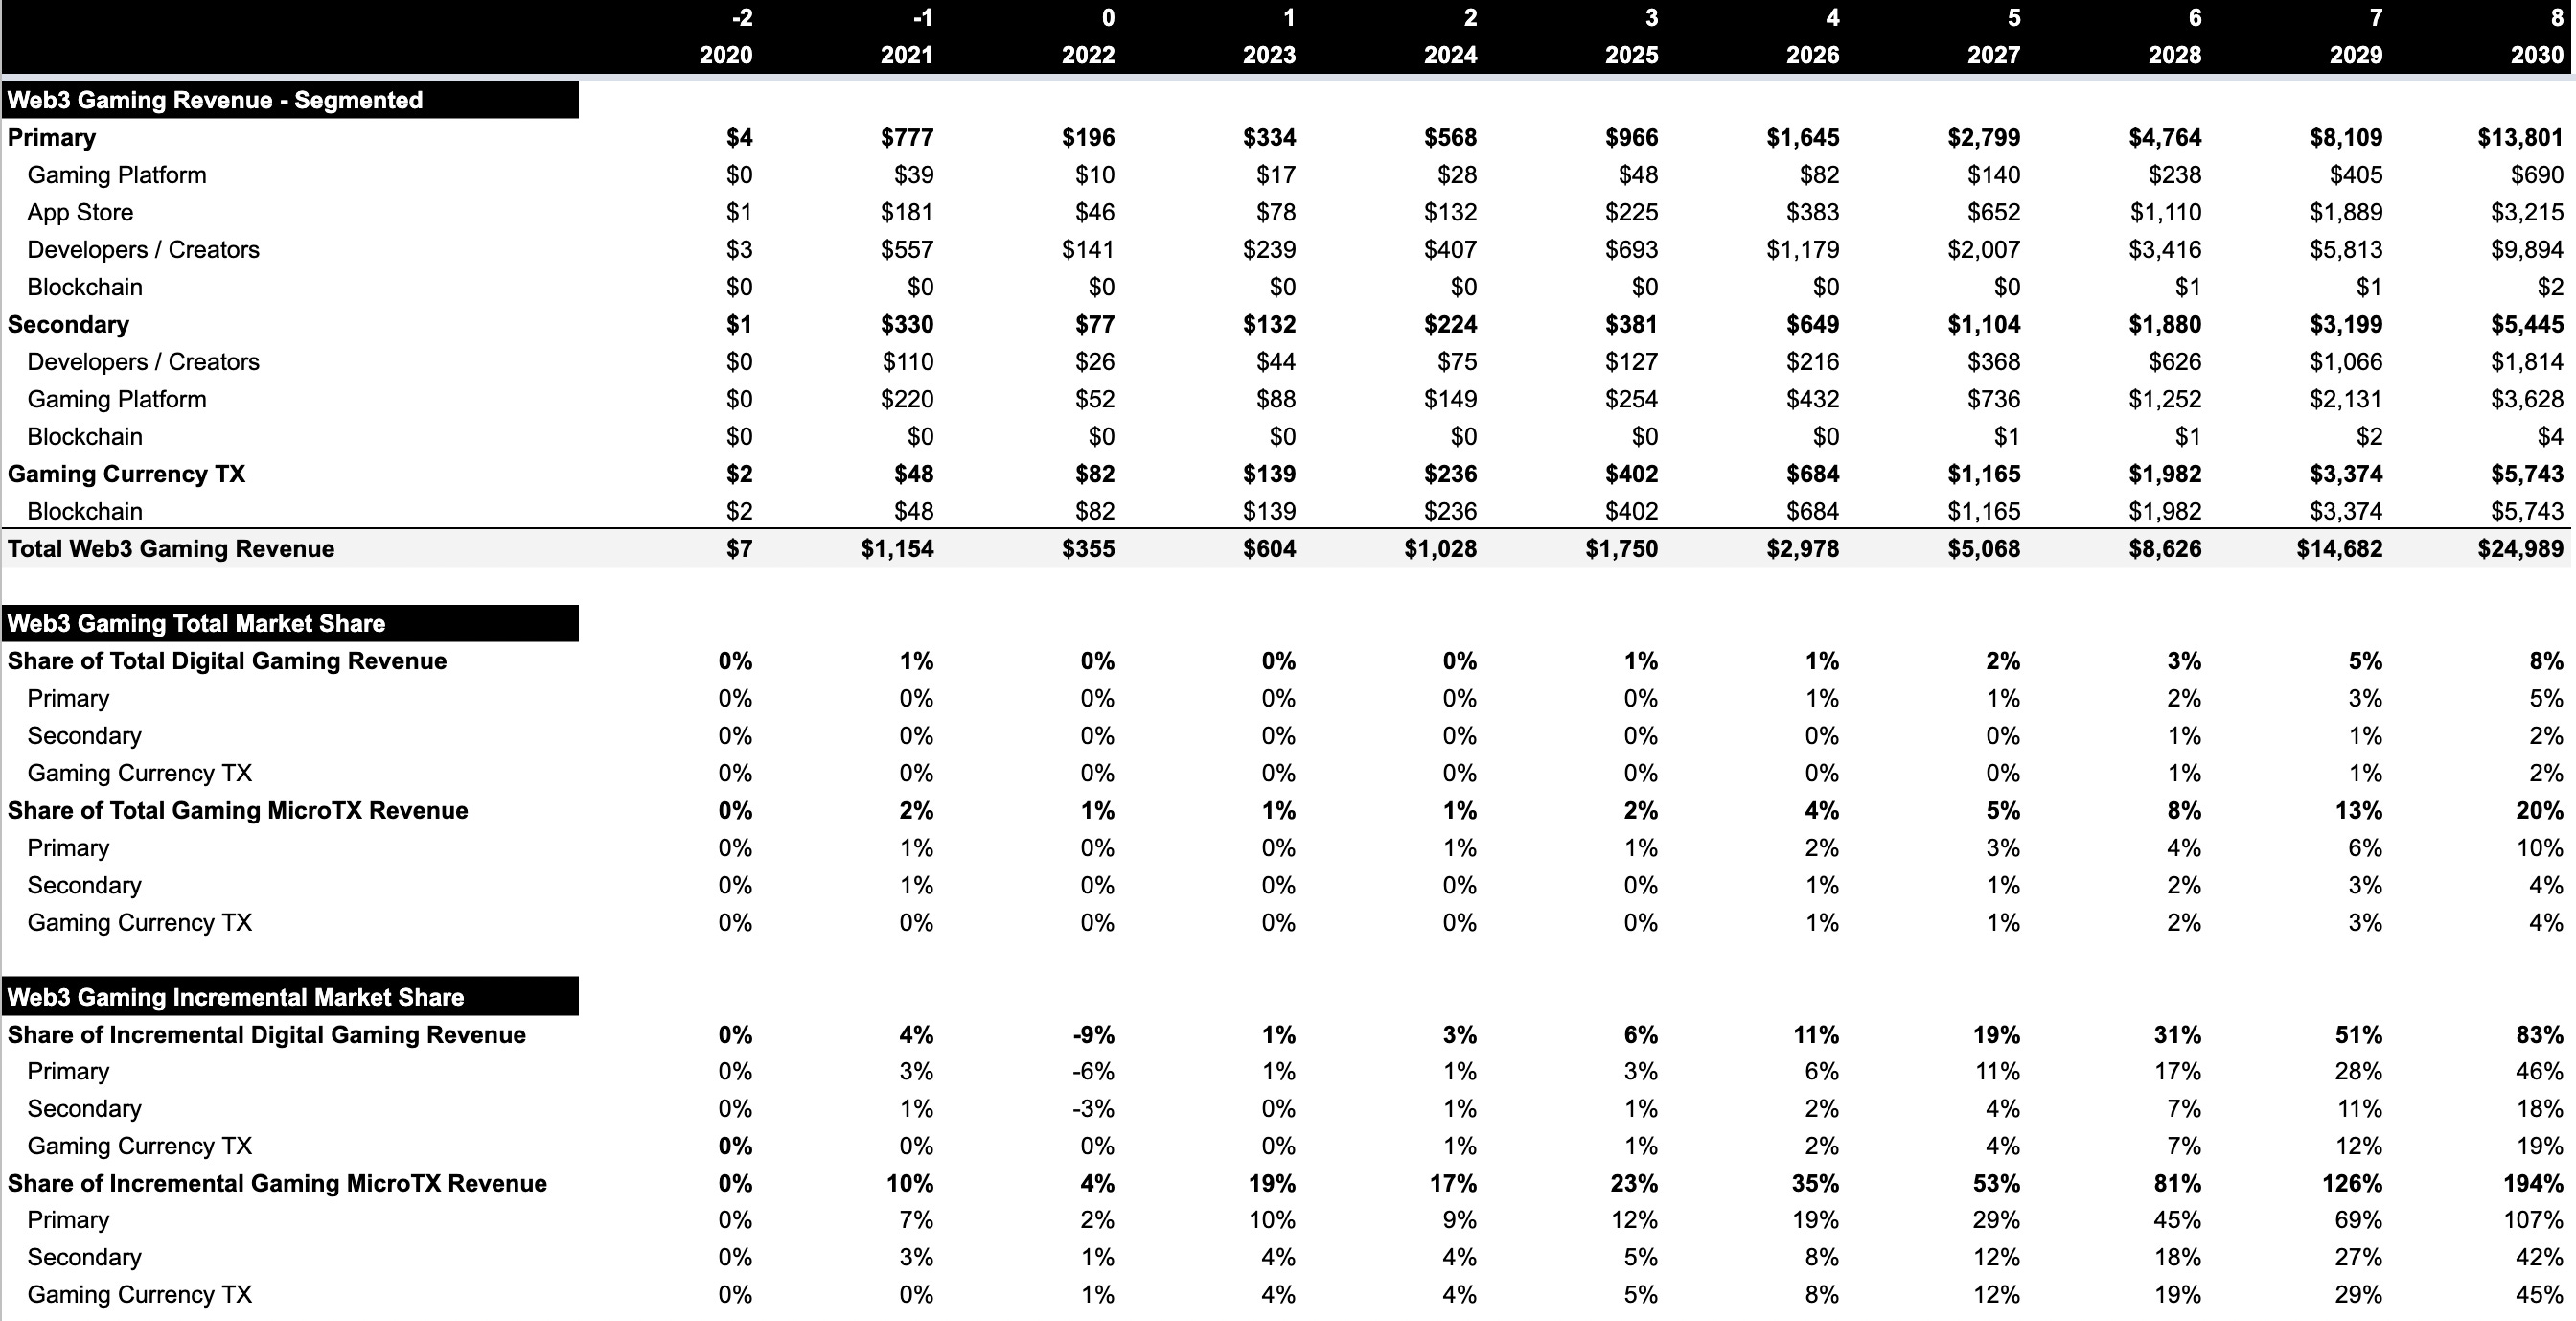
Web3 gaming revenue will increase from $355M in FY22 to $25B in FY30:
Primary market revenue will increase from $196M to $13.80B.
Secondary market revenue will increase from $77M to $5.45B.
GameFi currency transaction revenue will increase from $82M to $5.74B.
Web3 gaming’s share of total digital gaming revenue will increase from <1% to 8%, and its share of global digital gaming microtransaction revenue will increase from <1% to 20%.
The primary market will account for 46% of incremental global digital gaming revenue vs. 18% for the secondary market and 19% for the gaming currency market.
Gaming platforms will capture $4.32B, app stores will capture $3.22B, Developers / creators will capture $11.71B, and blockchain settlement platforms will capture $5.75B.
Developers / creators will capture 72% of primary market growth, gaming platforms will capture 67% of secondary market growth, and blockchain settlement platforms will capture 100% of gaming currency transaction growth, although games might choose to operate the settlement platform (e.g., Axie Infinity operating the Ronin blockchain.)
Nevertheless, the majority of existing web3 games with tokens seem vastly overvalued. Roblox’s market cap is $22B with 55M DAUs, 260M MAUs, and 4.20B registered accounts, which implies $400 per DAU, $85 per MAU, and $5 per registered account. Meanwhile, GameFi cryptocurrencies collectively boast an $8B market cap, which implies $7K per DAU, $2K per MAU, and $574 per web3 gamer. Are web3 DAUs 18x more valuable?

Possible Errors
The projections likely over-estimate the true number of Web3 gamers.
The 3.49M MAUs is summed across many different blockchains, but many web3 gamers play games on multiple blockchains with multiple different addresses. These gamers might be double-, triple-, or even quadruple-counted, as they would if we calculated total digital gaming MAUs by summing MAUs across all popular games. In reality, many gamers play multiple games each month, which would lead to significant double-counting. The same is true for DAUs.
Some players likely use several different addresses even on one single blockchain, especially since an estimated ~40% of gaming activity is generated by bots [11]. This is like double-counting one player with two Roblox accounts.
It is somewhat unclear whether the estimates only take into account players or whether they also take into account traders. While there are people counted in digital gaming DAUs / MAUs who primarily trade in-game items, I expect a much larger share in web3 given the primary emphasis on play-to-earn.
We can also estimate GameFi DAUs and MAUs by triangulating unique GameFi addresses created since inception with the ratio of Roblox DAUs and/or MAUs to unique Roblox accounts created since inception. As of FY22, Roblox boasted 4.20B total accounts, 55M DAUs (1.31%), and 260M MAUs (6.19%). Given 30.75M total GameFi addresses, that implies 403K GameFi DAUs (1.31%) and 1.90M GameFi MAUs (6.19%). This is 63% lower than our estimate of 1.10M DAUs and 46% lower than our estimate of 3.49M MAUs in FY22, which might substantiate the double-counting hypothesis.
Secondary market sales volume might be abnormally high relative to primary market volume due to speculative mania.
The global secondhand apparel market is only 6% of the global retail apparel market [12].
The global sneaker resale market is only 7% of the global sneaker market [13]
The global secondary ticketing market is only 33% of the global online ticketing market [14].
Notional amounts outstanding for equity-linked OTC derivatives contracts is only 11% of equities volume traded ($7T vs. $61T) [15].
Gaming currency TX volume might be overstated. DappRadar reports GameFi transaction volume of $1.26B on 7.65B TXs in FY22, which is only 9.71% of Footprint Analytics’ reported GameFi volume, because it only uses incoming volume to gaming smart contracts. By that standard, GameFi currency TX volume would amount to $89B by FY30.
The right royalty percentages could be higher or lower. For instance, all secondary market transactions involving NFTs on DraftKings marketplace currently incur a 10% royalty fee paid to the NFT creator and a 5% secondary market processing fee paid to DraftKings marketplace [16].
The gaming segment will be increasingly hard to isolate from other segments as the metaverse matures. This might lead to under- or over-estimating future gaming CAGRs and ARPU/ARPDAU.